The Baseline That Saves Your Life
Series 01: The Body's New Partner
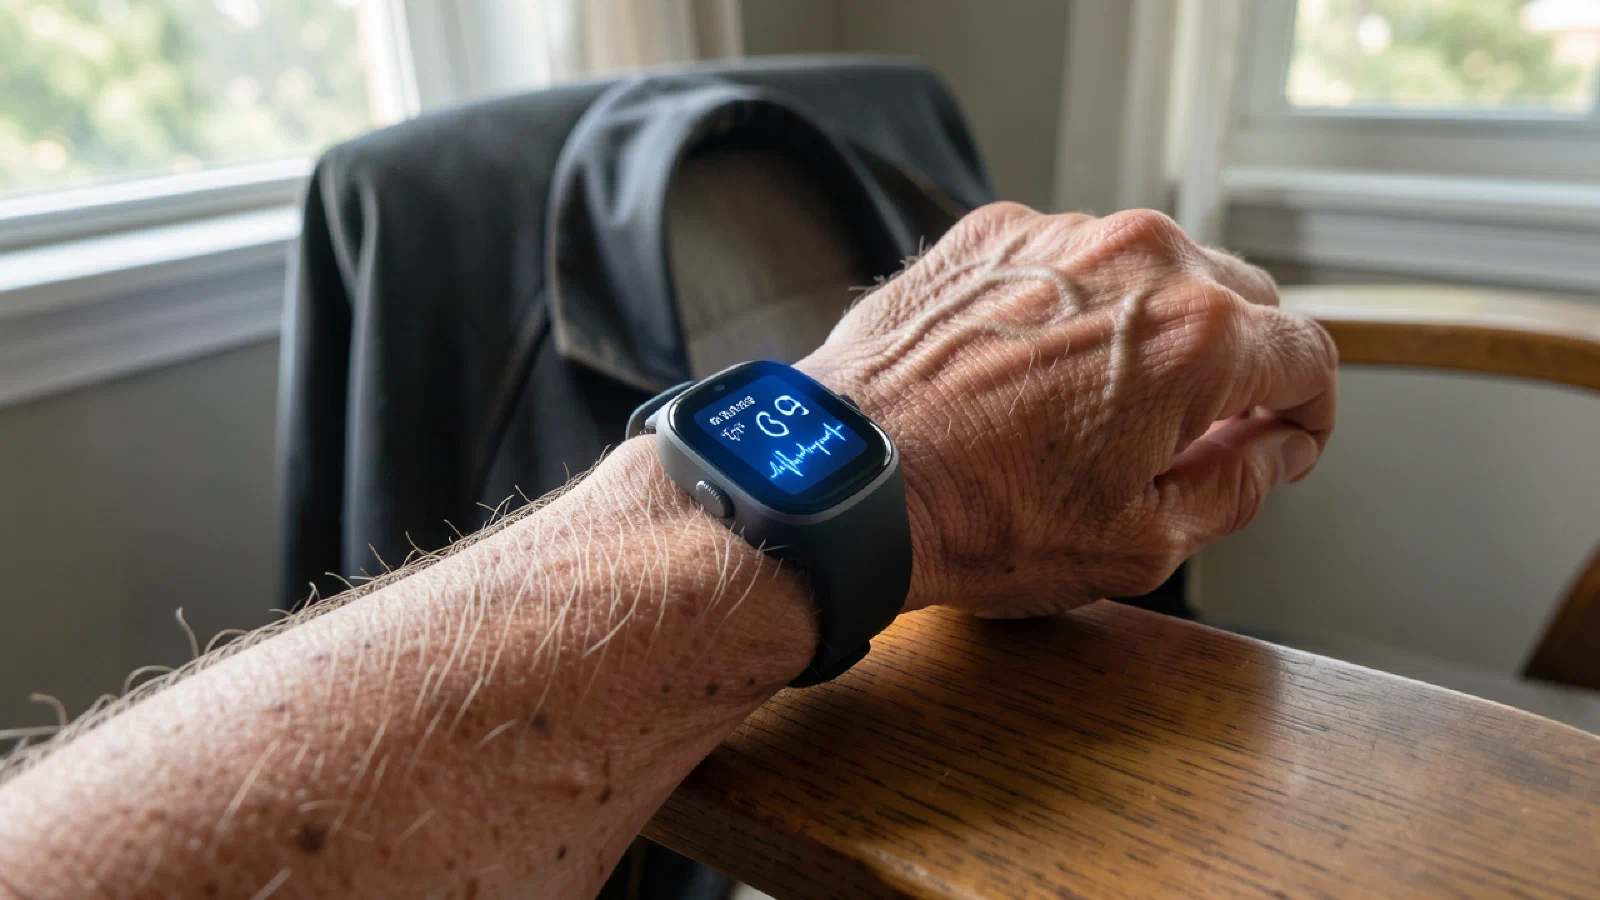
Carl Brandenberg is 71, a retired civil engineer from Portland, Oregon, and he has worn a health tracker for eight months because his daughter asked him to. He checks it about once a week. He does not consider himself a health-data person. He considers himself a person who agreed to wear a watch so his daughter would stop worrying.
On a Wednesday morning, his phone shows an alert he almost ignores. His resting heart rate has been running five to seven beats above his eight-month average for five consecutive days. His average walking speed has declined 19% over the same period. Neither number, by itself, would concern a physician looking at a population chart. Both numbers, compared to Carl’s personal history, are a signal.
His cardiologist has an appointment slot available in three weeks. His daughter says call today. He calls. They see him that afternoon. The pulmonary embolism has not yet produced the chest pain that would have sent him to the ER two days later. Carl did not detect a disease. His watch detected a deviation from Carl, and the deviation turned out to matter.
Why Your Baseline Is Not the Population’s#
A resting heart rate of 66 is, by any population standard, unremarkable. It falls in the middle of the normal range for a 71-year-old man. A physician seeing Carl for the first time and recording a resting heart rate of 73 would write “normal” and move on, because 73 is also in the normal range.
But 73 is not Carl’s normal. Carl’s resting heart rate, measured continuously for eight months, averages 66 with a standard deviation narrow enough that a five-beat sustained jump is a statistical event. The population does not have Carl’s eight months of data. Carl does. The distinction between “normal for adults over 70” and “abnormal for this specific adult over 70” is the entire value proposition of individualized baseline monitoring. It is a real distinction, and it matters most for conditions that present subtly before they present dramatically.
Population thresholds are the best available tool when individual data does not exist. They are the foundation of clinical screening. They save lives. But they are an average, and the person sitting in front of the physician is not an average. When continuous individual data exists, comparison to that individual’s own history becomes a more sensitive instrument than comparison to everyone else.
What Wearables Actually Track#
Consumer wearables in 2026 are capable devices with real limits. The Apple Watch, Fitbit, Garmin, and Oura Ring measure heart rate continuously with clinically acceptable accuracy for resting conditions. Heart rate variability, a useful marker of autonomic nervous system function, is standard across mid-range devices. Sleep staging has improved substantially since 2022 and now approximates clinical polysomnography in broad categories, though it still misses nuance in light-sleep transitions. Step count, distance, and activity-derived VO2 estimates are well validated.
Single-lead ECG, available on the Apple Watch and some competitors, can detect atrial fibrillation with sensitivity high enough to earn FDA clearance. Blood oxygen monitoring is available but remains less reliable during movement and in darker skin tones, a limitation the manufacturers acknowledge inconsistently. Continuous glucose monitors from Dexcom and Abbott provide real-time metabolic data, though these are medical devices that sit outside the standard wearable category and require a prescription for most use cases.
What consumer wearables cannot detect is the longer list. Most cardiac arrhythmias beyond atrial fibrillation. Most cancers. Most organ function decline. Blood chemistry. Infection. The devices are measuring what happens at the surface of the body, not what is happening inside it. The gap between what a wrist sensor records and what a blood panel reveals remains wide. Knowing where that line sits is the difference between using the tool well and expecting more than it can give.
The UTI Example#
Urinary tract infections in adults over 70 often do not present the way they present in younger adults. The burning, the frequency, the urgency that send a 35-year-old to urgent care may never appear. Instead, the first signs are behavioral: confusion, agitation, disrupted sleep, a personality shift that family members notice before the patient does.
An AI that has learned your sleep architecture over six months, that knows your typical restlessness pattern, your heart rate variability during sleep, your morning activity level, can detect a cluster of deviations three days before the classic symptoms emerge. It cannot diagnose a UTI. It can generate a hypothesis worth testing: something changed this week, across multiple streams, in a pattern that does not match your normal variation. That hypothesis, brought to a physician who orders a urine culture, catches the infection at day three instead of day six. In a 78-year-old with other comorbidities, those three days change the trajectory.
The research supports this pattern. Studies using wearable data during the COVID-19 pandemic showed that elevated resting heart rates relative to individual baselines predicted infection before symptom onset in a significant percentage of participants. The principle is the same: the body’s response to systemic stress shows up in the data before it shows up in the patient’s awareness.
What a Baseline AI Actually Requires#
Building a personal baseline takes time. Most platforms need 60 to 90 days of consistent data before the model of “you” is stable enough to distinguish real anomalies from noise. Some conditions require longer, particularly for sleep data, where seasonal variation, medication changes, and life events all affect the pattern.
It requires data density. Checking your heart rate once a week does not build a baseline. Continuous or near-continuous monitoring does. Carl wore his tracker every day for eight months, including overnight, which gave the system sleep data, resting data, and activity data in sufficient volume to learn his personal ranges.
It requires integration. A resting heart rate deviation is one signal. A resting heart rate deviation combined with a walking speed decline combined with a sleep efficiency drop is a different, stronger signal. The platforms that pull data from a single device produce single-stream baselines. The platforms that integrate multiple streams produce richer models, but they require the patient to wear and sync multiple devices, which is a compliance problem its own.
And it requires a clinical pathway. Carl’s deviation alert was only useful because he could get an appointment that afternoon. An anomaly detection system that generates an alert the patient cannot act on, because the next available appointment is in three weeks or the physician does not accept patient-reported device data, converts early detection into early anxiety. The connection between the alert and the clinical response is the least technical and most important part of the system.
The Physician Connection Problem#
Carl called his cardiologist’s office and said his watch showed an elevated heart rate for five days. The scheduler gave him a same-day slot. This happened because Carl’s cardiologist is familiar with wearable data, takes patient-reported trends seriously, and had availability. Those three conditions do not reliably co-occur.
Many physicians are skeptical of consumer wearable data, and the skepticism is not unreasonable. The devices generate false positives. Patients arrive with screenshots of heart rate spikes that reflect a loose wristband, not a cardiac event. The signal-to-noise ratio in consumer health data is genuinely low, and a physician who has been burned by three anxious patients with artifact data learns to discount the fourth, who may be Carl.
The gap between the data the AI generates and the clinical channels that exist to receive it is a real barrier. It is not a technology problem. It is a workflow problem, a reimbursement problem, and a trust problem, and it will take years of demonstrated value, not a software update, to close.
Privacy and Data Ownership#
Carl’s eight months of continuous physiological data live on a server. Whose server depends on the platform. What happens to that data when he cancels the subscription depends on the terms of service he did not read. Whether his insurance company can request it, whether law enforcement can subpoena it, whether a data breach exposes it are questions with answers that vary by platform, by state, and by year.
The person most closely monitored is the person most thoroughly documented. Eight months of heart rate, sleep, activity, and location data constitute a physiological biography that did not exist in consumer form ten years ago. The clinical value of that biography is real, as Carl’s story shows. The privacy cost of generating it is also real, and the two do not cancel each other out. They coexist, and the person deciding whether to wear the device should know both before buying it.
Knowing Sooner#
Carl’s pulmonary embolism was treatable. The treatment was the same whether it was caught on Wednesday afternoon or in the ER on Friday night. The difference was not the treatment. The difference was which version of the event Carl and his daughter experienced.
The Wednesday version: a phone call, a same-day appointment, a CT angiogram, anticoagulation therapy started in a controlled clinical setting, a follow-up plan, a drive home. The Friday version: chest pain at 2 AM, a 911 call, an ambulance, an ER admission, the same CT angiogram under emergency conditions, the same anticoagulation therapy started while Carl’s daughter is on a plane from Seattle.
The medical outcome might have been identical. The human outcome would not have been. The watch did not prevent the pulmonary embolism. It did not treat it. It narrowed the gap between when Carl’s body started signaling a problem and when someone who could help actually knew about it. Five to seven beats above baseline for five days. A 19% decline in walking speed. Numbers that meant nothing to the population and everything to Carl, because they were his numbers measured against his own history, and his history was the only instrument sensitive enough to hear what his body was saying.
How this article connects to others in Blue Mirror.
Sources cited in this article.
- Mishra, Tejaswini, et al. "Pre-Symptomatic Detection of COVID-19 from Smartwatch Data." Nature Biomedical Engineering, vol. 4, 2020, pp. 1208-1220.
- Perez, Marco V., et al. "Large-Scale Assessment of a Smartwatch to Identify Atrial Fibrillation." New England Journal of Medicine, vol. 381, no. 20, 2019, pp. 1909-1917.
- Gao, Shanghua, et al. "UniTS: A Unified Multi-Task Time Series Model." Advances in Neural Information Processing Systems, vol. 37, 2025, pp. 140589-140631.
- Gabrielli, Davide, et al. "AI on the Pulse: Real-Time Health Anomaly Detection with Wearable and Ambient Intelligence." Proceedings of the 34th ACM International Conference on Information and Knowledge Management, 2025.
- Radin, Jennifer M., et al. "Harnessing Wearable Device Data to Improve State-Level Real-Time Surveillance of Influenza-Like Illness in the USA." Lancet Digital Health, vol. 2, no. 2, 2020, pp. e85-e93.